Into the New Year, the remarkable, if mainly unreported, rebound in Arctic sea ice persists. The Arctic sea ice level on January 8th was at its highest level in 21 years, despite debatable claims that it was the “hottest year ever” (and that it will be even hotter in 2024) and further that we have reached GLOBAL BOILING. The sea ice record reached its third highest monthly gain in the modern 45-year record last December, according to the U.S.-based National Snow and Ice Data Centre (NSIDC).
As per the scientific blog No Tricks Zone, the reading as of January 8th has surpassed the average for the period between 2011 and 2020 by a significant margin. Additionally, it is higher than the 2001–2010 average and indicates a straight upward trend when compared to the 1991–2000 average.
The recovery’s scope is depicted in the graph below and 2023 is at highest level in over 20 years.

Source: https://nsidc.org/arcticseaicenews/charctic-interactive-sea-ice-graph/


Naturally, this only represents roughly half a winter’s worth of data, so we need to exercise caution and avoid adopting the alarmists’ preferred political trajectory of cherry-picking data and predicting a catastrophic climate collapse based only on isolated incidents. However, as recent articles on Daily Sceptic have shown, the current rebound in Arctic sea ice is part of a climate trend that dates back to about 2007. The data presented in a recent paper by Danish scientist Allan Astrup Jensen indicated a decline in sea ice between 1997 and 2007, but there were only minor losses in the 45-year record prior to and following this time frame. Tony Heller, an investigative journalist, uses a four-year moving average to demonstrate a slight improvement from roughly 2012 in September’s lowest ice extent. He adds that lower ice levels in the 1970s date back to the 1950s, and that 1979 was a recent high point.
In fact there is so much ice that Killer Whales are apparently stuck!
This year’s reading – up to January 8 – has now far exceeded the average for the years 2011-2020, also exceeds the average for the years 2001-2010, and points directly upwards [regarding] the years 1991-2000:


With all of this, how are the alarmists going to market their crazy collectivist Net Zero project? It might be suggested that you’re stuck up a frozen creek without an ice pick. Sir David Attenborough warned BBC viewers in 2022 that it might all disappear in 12 years from the summer sea ice. It appears that his laments have been guided more by wishful thinking and opinions fed into climate models than by the real data. However, if the ice keeps roaring back, the sea ice scare will probably have to be retired, much like all the disappearing coral on the Great Barrier Reef that is suddenly appearing in historic quantities.
The historical record, which dates back to the early 1800s, shows that cyclical natural climate variations are a more plausible explanation for trends in the polar sea ice extent. The climate in the far north is obviously driven by atmospheric heat exchanges and ocean currents, both of which have little understood effects. To understand Arctic glaciology, it would seem to be counterproductive to hold the belief that humans alone are responsible for controlling the temperature of the climate.
Similarly, Antarctica appears to present promising opportunities for those who believe in catastrophic events. The BBC reported on decreased winter sea ice levels last year compared to recent records. According to the BBC, it revealed a new standard for an area “that once seemed resistant to global warming.” Naturally, this inconvenient resistance alludes to Antarctica’s “nearly non-existent” warming over the previous 70 years. With helpful additions, Dr. Walter Meier of the NSIDC said, “It’s so far outside anything we’ve seen, it’s almost mind-blowing.” The “mind-blowing” comment garnered attention from mainstream media.

Unfortunately, Dr. Meier didn’t seem to remember that he was a member of the scientific team that deciphered the early Nimbus satellite data, which revealed even lower winter sea ice levels in 1966, less than ten years ago.
The Daily Sceptic was able to refresh Dr. Meier’s memory on his remarks at the time, and the Nimbus team had won awards at the time.
Even in the passive microwave record [available since 1979] for the Antarctic you see these seesaws where the ice concentrations go up and down, so extreme high or extreme low are not that unusual. What the Nimbus data tells us is that there’s variability in the Antarctica sea ice that’s larger than any we had seen from the passive microwave data. Nimbus helps put this in a longer term context and extends the record.
Cheers to the extended record. Given how quickly the Earth is heating up these days, it doesn’t seem to get much attention. Professor Ole Humlum’s map of Antarctic sea ice extent from 1979 is shown below.
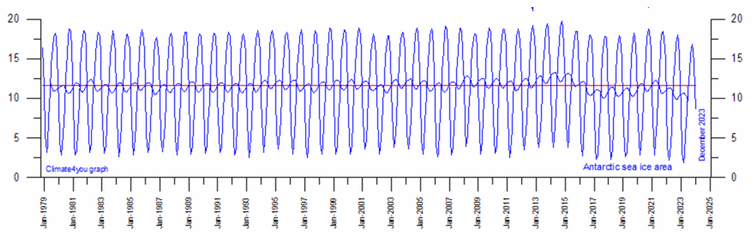
Upon examining the same data, Allan Jensen observes that there was hardly any downward trend during that time. The only pattern that stands out is an increase starting in July 2013 and a brief decline. Jensen cites 2022 and 2023 as recent years of decline. The NSIDC recorded extent at the end of the last month was only the sixth lowest in the record, indicating that any decline has recently slowed.

February 5, 2024


Recent Comments