The worst heatwaves were ALL in the past.
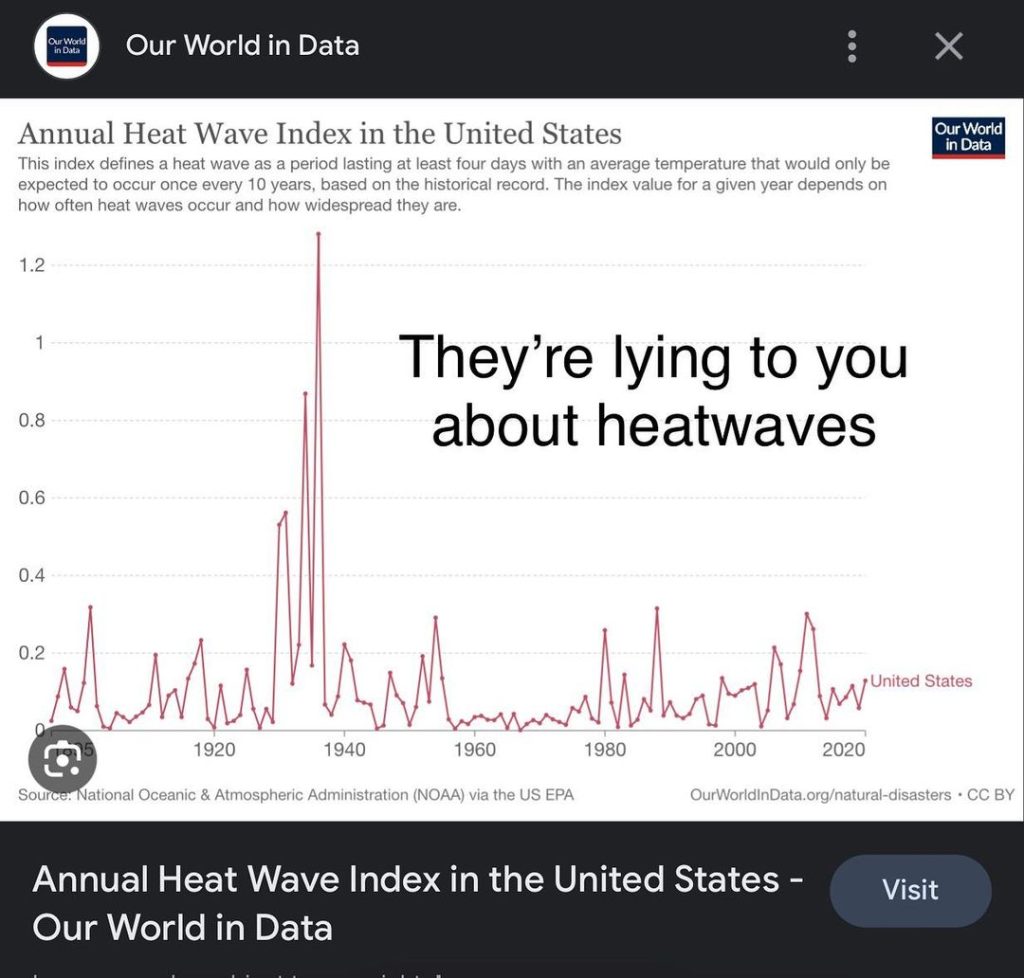
Source: https://ourworldindata.org/grapher/heat-wave-index-usa or https://www.epa.gov/climate-indicators/climate-change-indicators-heat-waves
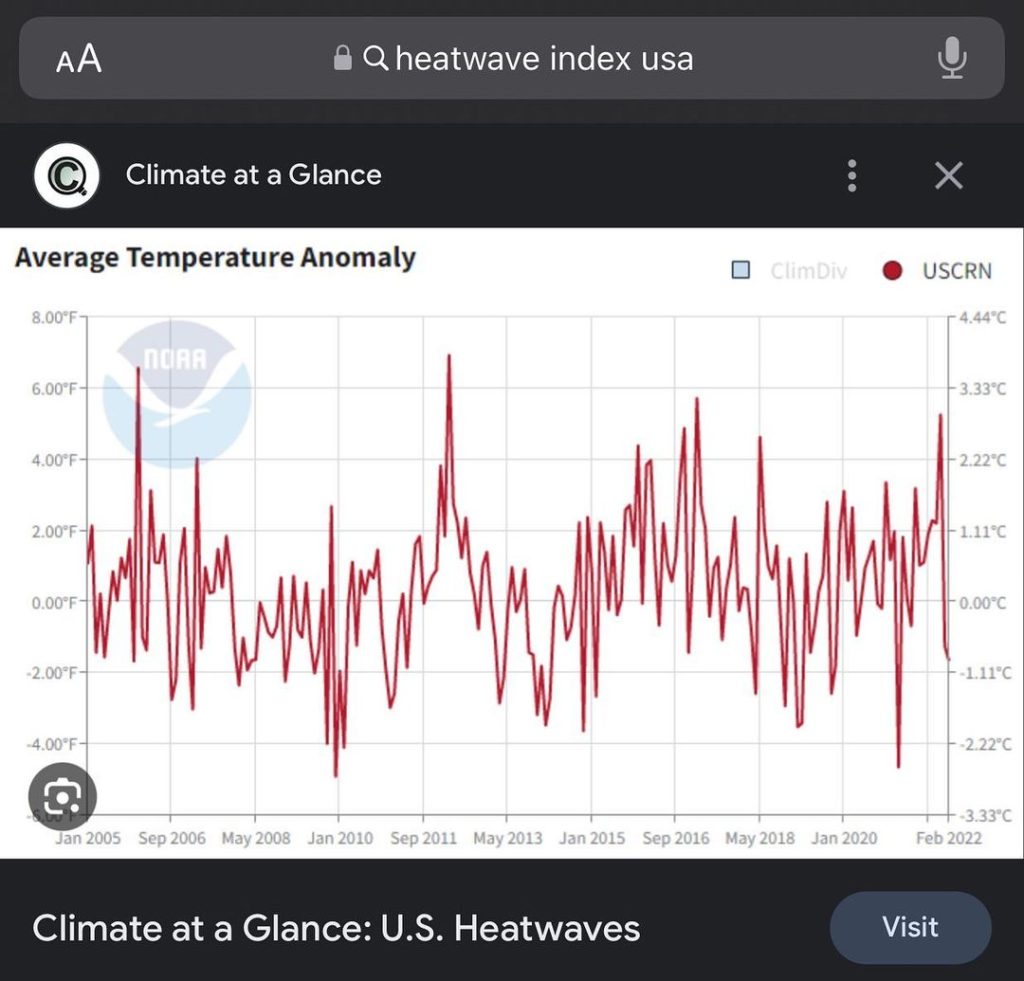
Average Temperature variations have remained steady and slightly declined since 2005

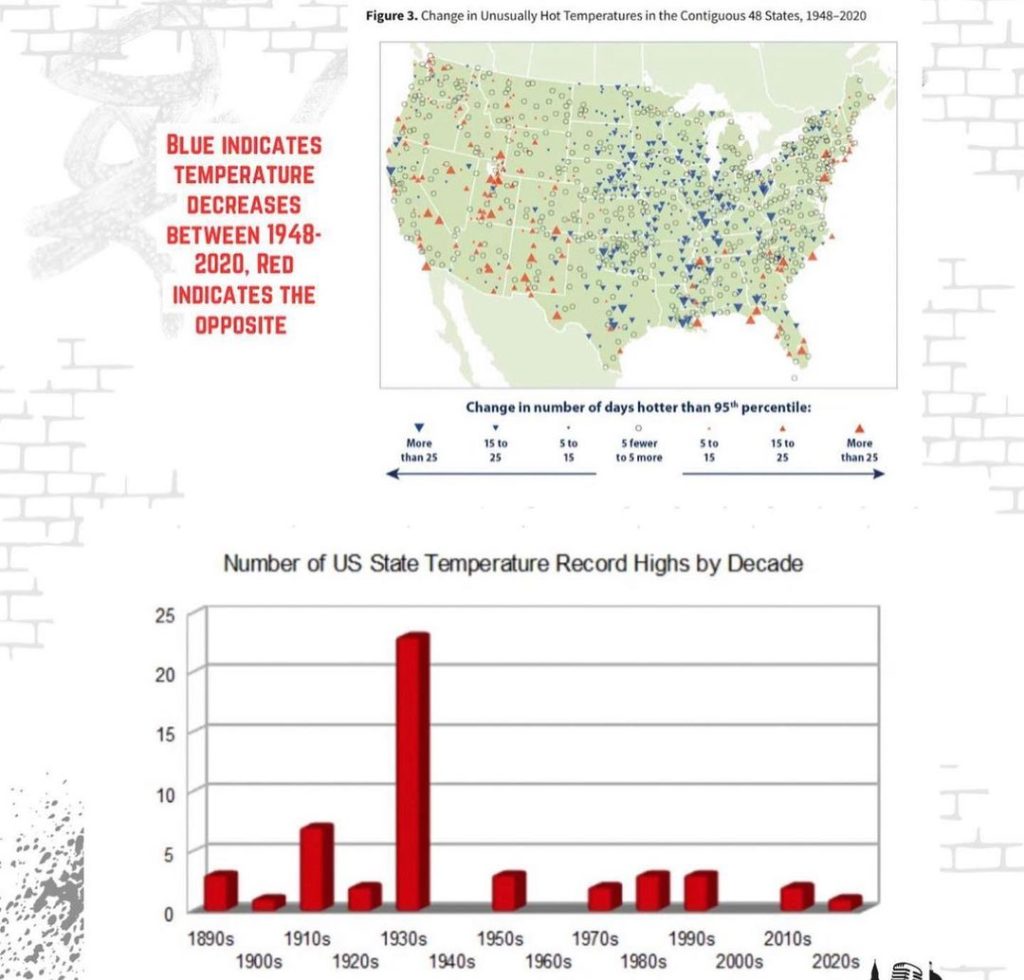
We had way more decreases in temperature than increases since 1948. And since 1890 we have had more high records recorded before 1990 than after.
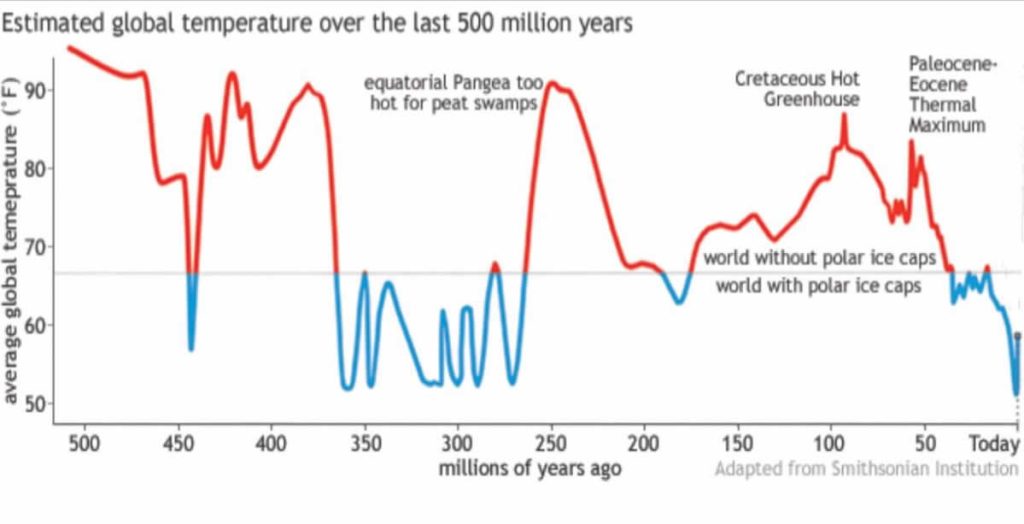
Here are the earths temperatures going back 500 million years. Currently we are in some of the coolest temperatures in history. As you can see the earths temperature fluxgates drastically, long before any humans ever existed. Currently we are warming after a period called the LITTLE ICE AGE.
Climate alarmists always start their measurements from 1850. WHY? Because that is the end of the little ice age and we have been warming ever since, ever slightly that is. About 0.6 degrees.
Why not go back 1000 years? Well the problem with that is that we have cooled a full degree since then. Or maybe we go back 3000 years….. OH Oh….. we have cooled almost 3 degrees since then.
How are you going to scare people with that information?
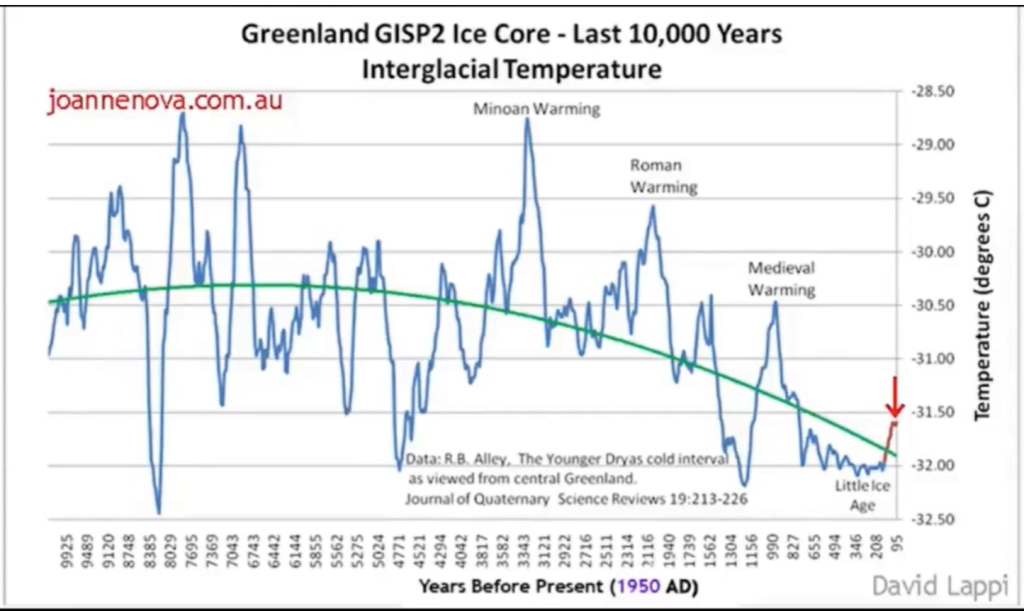
As you can see we are in some of the coolest times of the past 500 million years.
Media Propaganda about forest fires is out of control because it fits their climate change hysteria narrative.

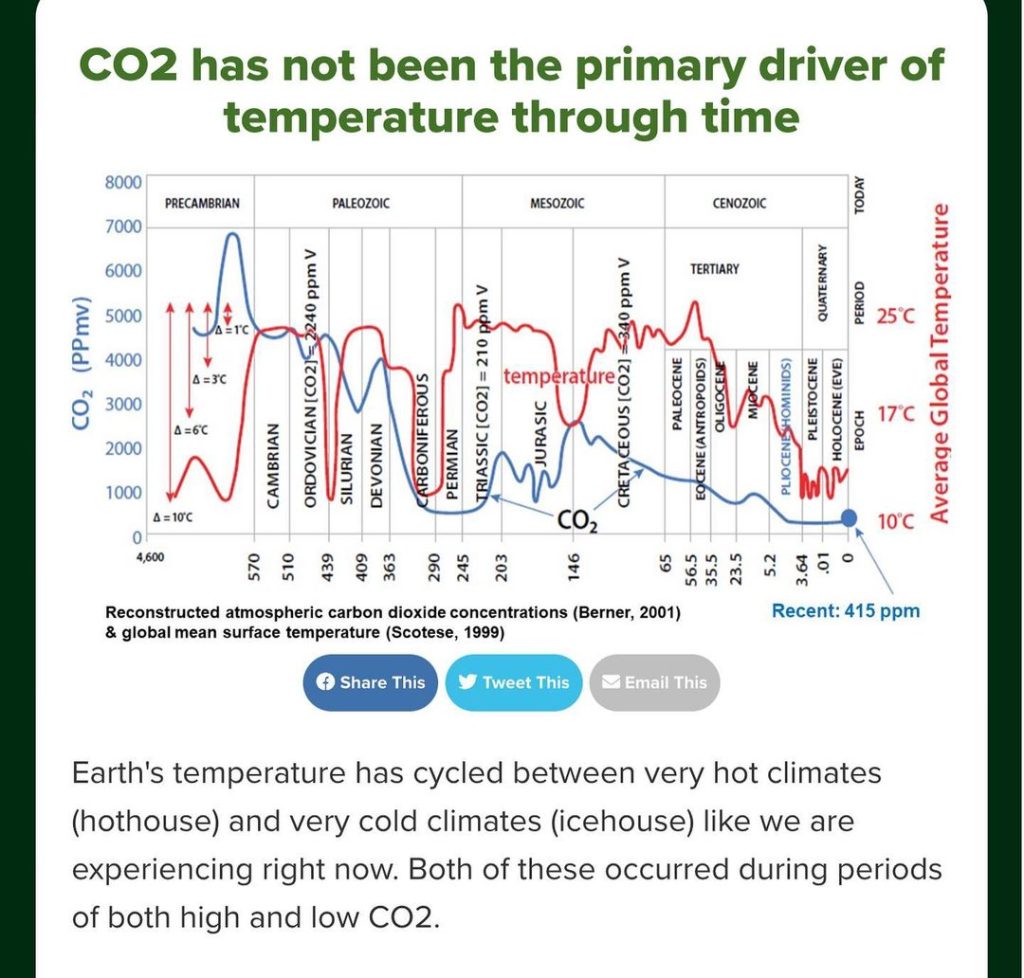
The chart below shows that CO2 and temperature are not related to each other whatsoever. This Chart goes back 600 million years.


Pingback: California Cloud seeding program is followed up by a major rain storm. - ROUTE 66 POST